

Easley Mixed-Use Property Management Case Study: Increasing Annualized Rent Roll by 40.4%
Jones Assurance Property Management began managing this Easley mixed-use building in February 2021. The property included six rentable units, with three commercial units and three residential units.
At takeover, the property’s contracted rent roll was $4,150 per month, or $49,800 annualized. However, one residential tenant was already planning to move out, creating immediate vacancy exposure shortly after management began.
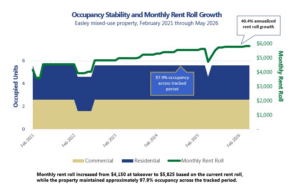
By the current rent roll, the property produces $5,825 per month, or $69,900 annualized. That represents a $20,100 increase in annualized contracted rent, or a 40.4% increase from the February 2021 takeover rent roll.
The value in this case study is not one major repositioning event. It is the compounding effect of unit-level rent management, tenant transitions, commercial and residential lease oversight, and vacancy control across a small mixed-use asset.
Executive Summary
From February 2021 through the current rent roll, Jones Assurance Property Management improved the property’s income profile while maintaining strong occupancy control.
- 40.4% increase in annualized rent roll: from $49,800 at takeover to $69,900 based on the current rent roll
- $20,100 increase in annualized contracted rent: compared to the February 2021 takeover rent roll
- 2.1% vacancy across the tracked period: with 8 vacant unit-months across 384 possible unit-months
- 97.9% occupancy across the tracked period: based on contracted rent history from February 2021 through May 2026
- Balanced mixed-use income profile: current rent roll is approximately 47.6% commercial and 52.4% residential
- All six units increased from starting rent to current rent: reflecting repeated unit-level execution rather than a single across-the-board adjustment
Property Snapshot
Property identity withheld for owner, resident, and tenant privacy.
| Category | Detail |
|---|---|
| Property Type | Mixed-use building |
| Market | Easley, South Carolina |
| Unit Count | 6 units |
| Unit Mix | 3 commercial units / 3 residential units |
| Management Start | February 2021 |
| Rent Structure | Gross rent only, no CAM charged |
| Utilities | Tenants pay their own utilities |
| Initial Monthly Rent Roll | $4,150 |
| Initial Annualized Rent Roll | $49,800 |
| Current Monthly Rent Roll | $5,825 |
| Current Annualized Rent Roll | $69,900 |
| Annualized Rent Roll Increase | $20,100 |
| Percent Increase | 40.4% |
The Asset Management Challenge
This property required a different management approach than a traditional residential rental portfolio.
A mixed-use building creates multiple layers of execution. Commercial units and residential units do not always lease on the same timeline, respond to the same market pressures, or carry the same turnover considerations. A vacancy in one commercial unit can affect the income profile differently than a residential vacancy, and each lease decision has to be evaluated in the context of the whole asset.
The mixed-use nature of the building added complexity. JAPM began managing the property in February 2021, during the post-COVID recovery period, when small commercial leasing still required careful execution around tenant fit, rent tolerance, lease timing, and vacancy risk.
The property also had immediate known vacancy exposure. At takeover, the February 2021 rent roll was $4,150 per month, but one residential tenant was already planning to move out. When that unit became vacant, the monthly rent roll temporarily dropped to $3,575.
That made the initial work more complex than simply managing an occupied building. JAPM needed to absorb the pending vacancy, re-lease the unit, and continue improving the rent roll without disrupting the rest of the property.
Operating Strategy
The strategy focused on incremental rent roll improvement rather than a single repositioning event.
Manage Known Vacancy Exposure
The first challenge was the residential vacancy that occurred shortly after takeover.
The property’s rent roll temporarily dropped from $4,150 to $3,575 per month when the planned move-out occurred. For a six-unit building, one vacancy represents a meaningful portion of income. The priority was to re-lease the unit while continuing to protect the broader rent roll.
This required practical leasing execution: preparing the unit, pricing it correctly, and filling the vacancy without allowing the transition to create longer-term income drag.
Reset Rents During Tenant Transitions
The strongest rent growth occurred when units could be reset during tenant transitions.
That is important because existing tenant increases and new lease pricing are different management decisions. In-place increases require attention to tenant stability and retention risk. Turnovers create an opportunity to evaluate the unit against current market conditions, make needed adjustments, and reset the rent more substantially where the market supports it.
Across the management period, JAPM used these transitions to move individual units closer to their current income potential.
Improve the Rent Roll Unit by Unit
This was not a case where one rent increase changed the property’s performance.
Each unit required its own path. Some units improved through modest increases. Others improved through tenant changes, market resets, or new lease pricing. The result was a stronger total rent roll built through repeated individual decisions.
That unit-level approach mattered because the building had both commercial and residential exposure. Rent growth had to be managed across both sides of the property, not treated as one uniform group.
Preserve Occupancy While Increasing Income
For a six-unit mixed-use building, vacancy control is a major part of asset performance.
Across the tracked period, the property had 8 vacant unit-months across 384 possible unit-months, resulting in approximately 2.1% vacancy and 97.9% occupancy.
That occupancy profile is one of the strongest points in the case study. The property’s rent roll improved materially without relying on extended vacancy, repeated downtime, or a disruptive repositioning strategy.
Performance Results
Annualized Rent Roll Increased 40.4%
At takeover, the property’s monthly rent roll was $4,150, or $49,800 annualized.
The current monthly rent roll is $5,825, or $69,900 annualized.
| Metric | Amount |
|---|---|
| February 2021 Monthly Rent Roll | $4,150 |
| February 2021 Annualized Rent Roll | $49,800 |
| Current Monthly Rent Roll | $5,825 |
| Current Annualized Rent Roll | $69,900 |
| Increase in Annualized Rent Roll | $20,100 |
| Percent Increase | 40.4% |
This is the primary performance metric for the case study. It compares the contracted rent roll at takeover to the current contracted rent roll using the same annualized method.
Immediate Vacancy Exposure Was Managed
The property also had near-term vacancy exposure at takeover.
One residential tenant was already planning to move out. When that unit became vacant, monthly rent temporarily dropped to $3,575, or $42,900 annualized.
| Metric | Amount |
|---|---|
| February 2021 Rent Roll | $4,150 per month |
| Vacancy-Exposed Rent Roll | $3,575 per month |
| Monthly Income Exposure | $575 |
| Vacancy-Exposed Annualized Run Rate | $42,900 |
This is not the primary baseline for the case study, but it is important operating context. JAPM did not take over a static, fully stabilized rent roll. The property had a known tenant transition that needed to be managed immediately.
Vacancy Remained Low Across the Tracked Period
From February 2021 through May 2026, the building had 384 possible unit-months across six units.
Only 8 unit-months were vacant.
| Metric | Value |
|---|---|
| Possible Unit-Months Tracked | 384 |
| Vacant Unit-Months | 8 |
| Vacancy Rate | 2.1% |
| Occupancy Rate | 97.9% |
For a small mixed-use building, this is a meaningful performance indicator. A single vacancy has a larger effect on a six-unit building than it would on a larger property. Keeping vacancy low while improving rent levels helped protect the property’s income profile during the management period.
Current Income Mix Remains Balanced
The current rent roll is also balanced between commercial and residential income.
| Income Type | Current Monthly Rent | Share of Current Rent Roll |
|---|---|---|
| Commercial Units | $2,775 | 47.6% |
| Residential Units | $3,050 | 52.4% |
| Total | $5,825 | 100.0% |
This matters because the building is not dependent on only one income category. The commercial and residential sides both contribute meaningfully to the property’s current rent roll.
Unit-Level Rent Growth
All six units increased from their starting rent to their current rent.
| Unit | Type | Starting Rate | Current Rate | Dollar Increase | Percent Increase |
|---|---|---|---|---|---|
| A | Commercial | $675 | $900 | +$225 | +33.3% |
| B | Commercial | $650 | $1,000 | +$350 | +53.8% |
| C | Commercial | $750 | $875 | +$125 | +16.7% |
| D | Residential | $650 | $1,100 | +$450 | +69.2% |
| E | Residential | $675 | $1,000 | +$325 | +48.1% |
| F | Residential | $750 | $950 | +$200 | +26.7% |
The largest increases came from Unit D, Unit B, and Unit E. Those improvements were driven by unit-level decisions, tenant transitions, and market-based pricing rather than a single rent adjustment across the whole building.
Why This Case Study Matters
Small mixed-use properties are easy to misread.
A building may look stable because most units are occupied, but the rent roll may still be below its achievable level. At the same time, pushing too aggressively can create vacancy that offsets the benefit of higher rent.
This case study shows the value of operating discipline in a smaller asset. The result came from managing each unit according to its use, tenant situation, timing, and rent potential.
Jones Assurance improved the property’s performance because several small decisions compounded over time:
- Immediately managed vacancy exposure
- Commercial and residential rents were reviewed separately
- Unit-level increases were made where supported
- Tenant transitions were used to reset rents
- Vacancy was kept low across the tracked period
- The income mix remained balanced between commercial and residential units
For owners of small mixed-use buildings, that combination matters. Income growth is not only about the final rent number. It also depends on vacancy control, lease timing, tenant fit, and the ability to adjust rents without destabilizing the asset.
Methodology
This case study uses contracted rent roll data from February 2021 through May 2026.
The starting baseline is the February 2021 contracted rent roll, which was $4,150 per month, or $49,800 annualized. This was the rent roll in place when Jones Assurance Property Management began managing the building.
The current annualized rent roll is based on the current contracted rent roll of $5,825 per month, multiplied by 12, for a current annualized rent roll of $69,900.
The rent structure is gross rent only – we do not charge CAM on this property. Tenants pay their own utilities.
We are calculating vacancy using possible unit-months across the tracked period. From February 2021 through May 2026, six units created 384 possible unit-months. The property had 8 vacant unit-months, resulting in approximately 2.1% vacancy.
We have intentionally excluded tenant names and business names. We also withheld the property identity for owner, resident, and tenant privacy.
Performance is presented at the property level based on documented rent roll and scheduled income tracking during the management period. Figures are rounded to standard reporting levels for clarity.
Final Outcome
Jones Assurance Property Management increased the building’s annualized rent roll from $49,800 at takeover to $69,900 based on the current contracted rent roll.
That represents a $20,100 increase in annualized contracted rent, or a 40.4% increase.
During the same tracked period, the property maintained approximately 97.9% occupancy, with only 8 vacant unit-months across 384 possible unit-months.
The current rent roll remains balanced, with approximately 47.6% commercial income and 52.4% residential income.
The performance improvement was driven by unit-level rent roll management, vacancy control, commercial and residential lease oversight, tenant transitions, and market-based rent resets over time.
Firm Profile
Jones Assurance Property Management operates across residential, multifamily, and select mixed-use assets in Easley, Greenville, and Upstate South Carolina. The firm’s approach includes rent analysis, leasing execution, tenant communication, renewal management, maintenance coordination, reporting, and operational review of property performance.
This case study documents one example of Easley mixed-use property management execution based on actual operating and rent performance data.
Relevant Resources
- Easley Property Management Services
- Residential Property Management Services
- Commercial Property Management
- Rental Income Calculator
- Contact Jones Assurance Property Management
Disclaimer
This case study reflects one property’s actual performance. Results vary by property condition, location, tenant demand, rent positioning, lease timing, commercial use, residential demand, vacancy, tenant history, and owner objectives.
Case Study FAQ
What type of property is this case study based on?
This case study is based on an anonymous six-unit mixed-use building in Easley, South Carolina. The property includes three commercial units and three residential units.
When did Jones Assurance Property Management begin managing the property?
Jones Assurance Property Management began managing the property in February 2021.
What was the rent roll when JAPM took over?
At takeover, the property’s contracted rent roll was $4,150 per month, or $49,800 annualized.
What is the current rent roll?
The current contracted rent roll is $5,825 per month, or $69,900 annualized.
How much did the annualized rent roll increase?
The annualized rent roll increased by $20,100, from $49,800 to $69,900. That represents a 40.4% increase.
Did the property have vacancy when JAPM took over?
At takeover, the property was producing $4,150 per month, but one residential tenant was already planning to move out. When that unit became vacant, the monthly rent roll temporarily dropped to $3,575.
How much vacancy did the property have during the tracked period?
From February 2021 through May 2026, the property had 8 vacant unit-months across 384 possible unit-months, resulting in approximately 2.1% vacancy and 97.9% occupancy.
Is the property primarily commercial or residential?
The property has a balanced mixed-use income profile. Based on the current rent roll, approximately 47.6% of rent comes from commercial units and 52.4% comes from residential units.
Are tenant or business names included?
No. We excluded tenant names, business names, and the specific property identity for privacy.
Does this case study guarantee similar results?
No. This case study reflects one property’s actual performance. Results vary based on property condition, location, tenant demand, commercial use, rent levels, vacancy, lease timing, and owner objectives.